Tuesday, 6 March 2018
Monday, 12 February 2018
Tuesday, 30 January 2018
Friday, 26 January 2018
Indian Indices: Divergence between indices warrant caution
 |
| Nifty 50 |
 |
| Nifty Midcap 100 |
 |
| Nifty Next 50 |
 |
| Nifty Smallcap 100 |
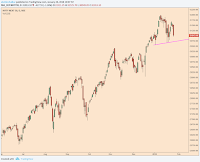
The charts above represent the daily chart of Nifty 50, Nifty Next 50, Nifty Midcap 100, and Nifty Smallcap 100 indices (Chart source: Tradingview). Indian markets have been in a robust up trend over the past couple of years, moving in tandem with global peers.
Thursday, 25 January 2018
Wednesday, 24 January 2018
U.S. 10-year Yield: Secular downtrend nearing an end
 |
| U.S. 10-yr Yield Monthly Chart (Chart Source: Investing) |
The chart above depicts the monthly line chart of the U.S. 10-year Yield over the course of the past 30 years. It is quite evident that the benchmark Yield has been in a secular downtrend during this time period characterized by the formation of lower peaks and lower toughs.
Tuesday, 23 January 2018
Castrol India: A potential reversal in sight
 |
| Castrol India Daily Chart (Chart source: Tradingview) |
Castrol India seems to have completed the D leg of a bullish Gartley pattern, as has been highlighted in the chart above. A bullish Gartley pattern is a bullish reversal pattern that is based on various fibonacci ratios and one which marks the end of a price decline.


