Tuesday, 30 January 2018

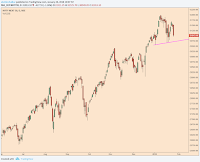
USD/JPY: A recovery could kick in soon

USD/JPY Daily Chart (Chart source: Investing)

USD/JPY has been in a downward trajectory over the past couple of months, as the pair has been pressurized by broader dollar weakness against the G7 basket.

Friday, 26 January 2018

Indian Indices: Divergence between indices warrant caution

               
               Nifty 50
Nifty Midcap 100


             Nifty Next 50
Nifty Smallcap 100

The charts above represent the daily chart of Nifty 50, Nifty Next 50, Nifty Midcap 100, and Nifty Smallcap 100 indices (Chart source: Tradingview). Indian markets have been in a robust up trend over the past couple of years, moving in tandem with global peers.

Thursday, 25 January 2018

Eicher Motors: Testing crucial support level

Eicher motors Weekly Chart (Chart source: Investing)

Eicher Motors has been in a steep downtrend over the past few weeks. The decline has now approached a crucial infliction point, as can be seen in the chart above. A couple of key supports are seen confluencing around 26000.

Cipla: Gearing up for an up move

Cipla Daily chart (Chart source: Tradingview)

Cipla is just breaking out an inverse H&S pattern, as can be seen in the daily chart above. The breakout has also been accompanied by a bullish MACD signal, with the MACD line crossing above its signal line while being in positive territory.

Wednesday, 24 January 2018

U.S. 10-year Yield: Secular downtrend nearing an end

U.S. 10-yr Yield Monthly Chart (Chart Source: Investing)

The chart above depicts the monthly line chart of the U.S. 10-year Yield over the course of the past 30 years. It is quite evident that the benchmark Yield has been in a secular downtrend during this time period characterized by the formation of lower peaks and lower toughs.

Tuesday, 23 January 2018

Castrol India: A potential reversal in sight

Castrol India Daily Chart (Chart source: Tradingview)

Castrol India seems to have completed the D leg of a bullish Gartley pattern, as has been highlighted in the chart above. A bullish Gartley pattern is a bullish reversal pattern that is based on various fibonacci ratios and one which marks the end of a price decline.

Monday, 22 January 2018

BPCL: Watchout for potential reversal in trend

BPCL Daily Chart (Chart source: Tradingview)

BPCL seems to forming a bullish Gartley pattern, as has been highlighted in the chart above. A bullish Gartley pattern is a bullish reversal pattern that is based on various fibonacci ratios and one which marks the end of a price decline.

Gold: Approaching crucial resistance zone

Gold Monthly Chart (Chart source: Tradingview)

After breaking the $1,500 major support in 2013, gold came under immense selling pressure, tumbling towards the psychological $1,000 level over the course of the next two-and-half years.

Saturday, 20 January 2018

Bitcoin: Expecting an eventual move to new highs

Bitcoin Daily chart (Chart source: Tradingview)


The graph above represents the daily chart of Bitcoin (Symbol: BTC/USD, Bitstamp). BTC and other crypto currencies are gaining a lot of attention from traders and investors these days given the massive swing in price movements seen in these instruments.